2. Visualize Insights: Comparison
This is a basic one, people.
And sometimes, the basics are the best.
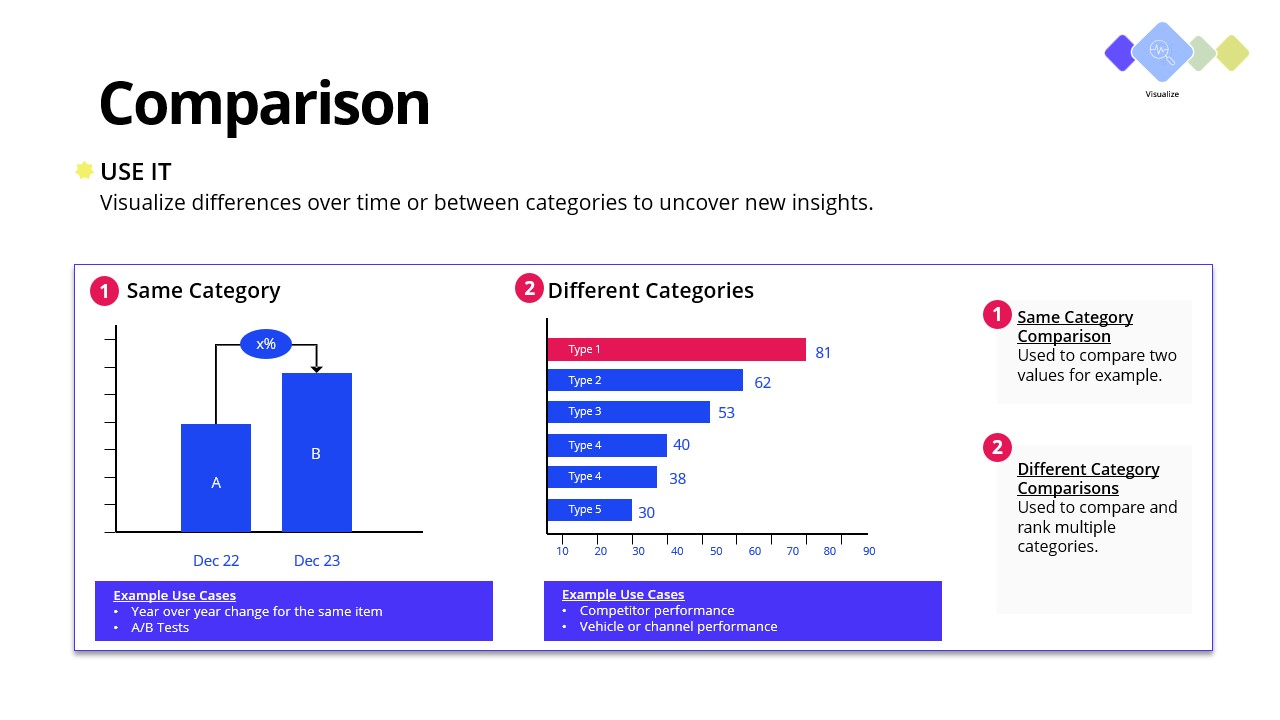
The easiest way to make a point and visualize growth, loss, or change is with a Comparison chart.
We all know how to make a bar graph, but the trick here is to show the delta between the bars.
This visualization helps the audience get to the point, which is that there’s a change.
With a Comparison chart, they stop spending the first 30 seconds deciphering the chart and connect the dots right away.
Picture a SaaS client who’s convinced they had a sales problem.
Targets were missed, and everyone was pointing at the pipeline.
Using a Comparison chart, their consultant broke down revenue by product and over time.
Pretty quickly, the story changed.
One core product did most of the heavy lifting, while newer offerings weren’t gaining traction.
Instead of pushing the sales team harder, the company refocused efforts on what was working and fixed what wasn’t.
The result? They unlocked growth without overcomplicating the plan.
Save time and grab this template for your next engagement:
Step 2 - Comparison.pptx