2. Visualize Insights: Pareto Chart
Ever had a client insist the root cause of a problem is impossible to find?
It’s not.
Most of the time, only 80% of the outcomes come from 20% of the inputs.
Fix that 20% and you’ll drive 80% improvement.
Enter: the Pareto Chart.
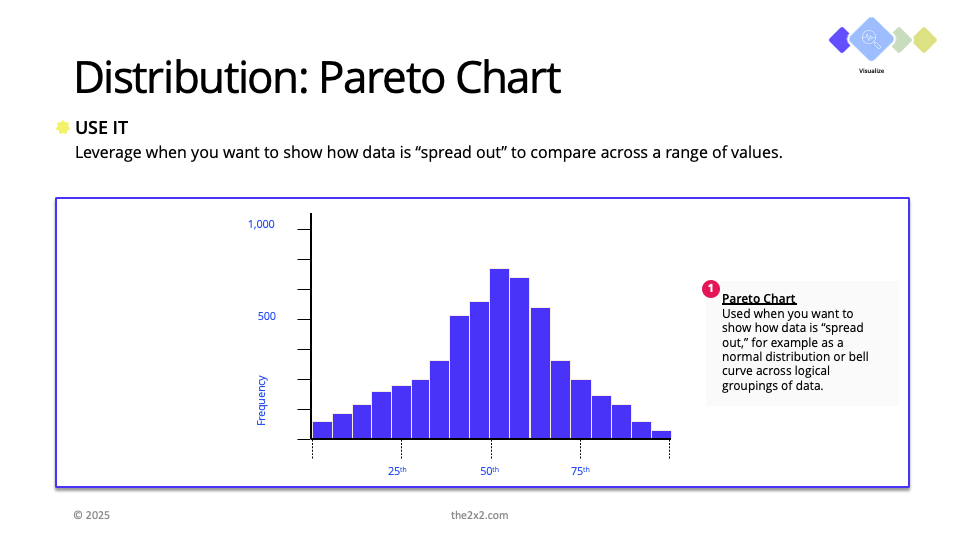
This little gem shows exactly where the real pain is hiding with clear, ranked data.
With the Pareto Chart, you can find out where the concentration of an issue lies – which your team can focus on without getting distracted about the “edge” issues.
Picture a fractional COO pulled into a SaaS company buried in customer complaints.
The CEO thought they needed more support staff. But instead of throwing headcount at the problem, the consultant pulled support ticket data and ran a Pareto Chart.
Bingo: 25% of the tickets – mostly from Product B – took over 72 hours to resolve.
Investing further, three root causes showed up on repeat: connectivity failures, billing errors, and broken API calls.
Armed with this, the consultant focused on solving those three issues.
Within six weeks, long-resolution tickets dropped by half, customer churn stabilized, and the team stopped playing whack-a-mole.
No big restructuring. No extra hires. Just the right insight at the right time.
Save time and download our template here:
Step 2 - Pareto Chart.pptx